Shop
Showing 1–16 of 146 resultsSorted by latest


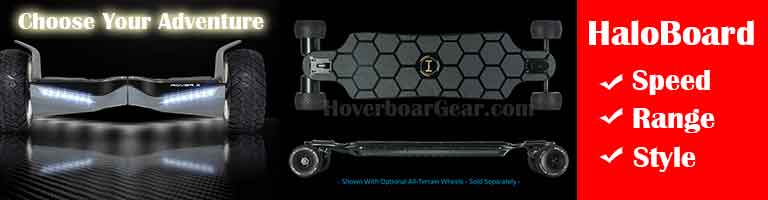
- Halo Beast Electric Skateboard: 3200 Watt - Dual 1600 Watt Brushless Direct-Drive Motors. Destroy hills that get in your way and maintain top speeds of 26 MPH with 3200 Watts of power at your fingertips. With swappable All-Terrain Wheels, you can blast through tough terrain on your route. These 120mm wheels truly make this electric skateboard the Halo Beast!
- Meepo NLS Pro: A favorite among budget-conscious riders, the Meepo NLS Pro offers an impressive performance-to-price ratio. With its dual 540W motors, this board can easily conquer hills and reach speeds of 28 mph. Its lightweight design and customizable features make it a great option for those who want a reliable ride without breaking the bank.
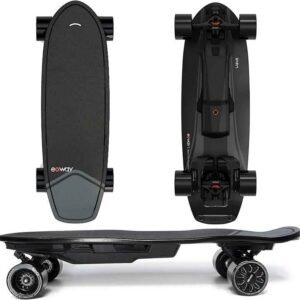
- WowGo 3X: The WowGo 3X stands out with its customizable riding modes, allowing users to tailor their experience to match their skill level. Equipped with dual 1200W motors, it delivers a strong and smooth ride, while its 12S battery provides a commendable range of up to 20 miles. Riders appreciate its solid construction and the inclusion of a wireless remote for precise control.
Showing 1–16 of 146 resultsSorted by latest


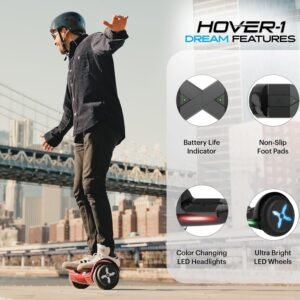
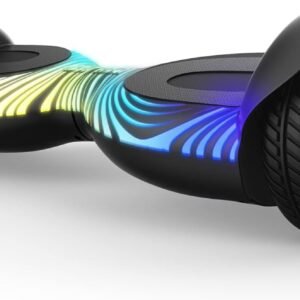
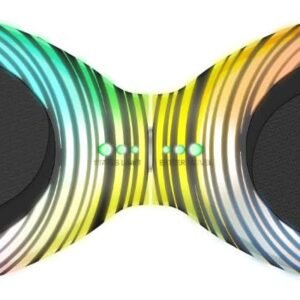
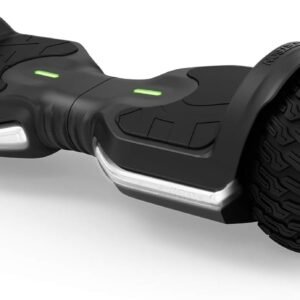
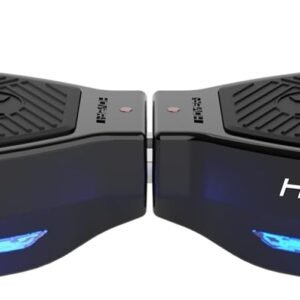
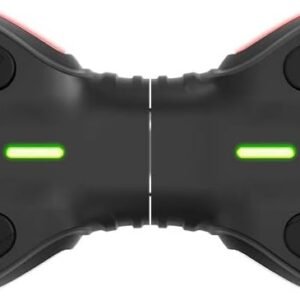
 H1 is powered by two 200W motors that enable it to climb 15 degree inclines and reach a 9 mph top speed. The 6.5″ solid wheels provide a smooth and enjoyable ride.